
Parametric Curves
By Natalie Streiner
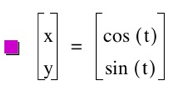
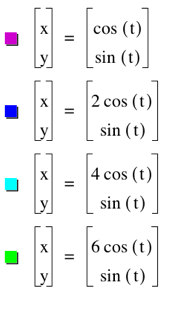
Let’s focus on the parametric equations
x= a cos (t)
y= b sin (t)
for 0 < t < 2π
We are going to
investigate how various values of a and b change the
graph of our equations.
We will start by
graphing
x= a cos (t)
y= b sin (t)
when a and b are equal to 1.
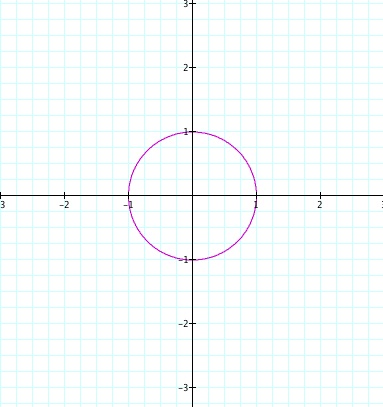
Here we see a
circle of radius 1.
Now, let’s see what
happens when we increase both a and b at the same
time.
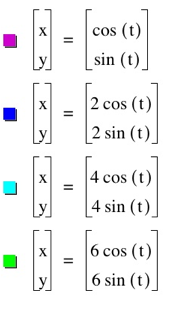
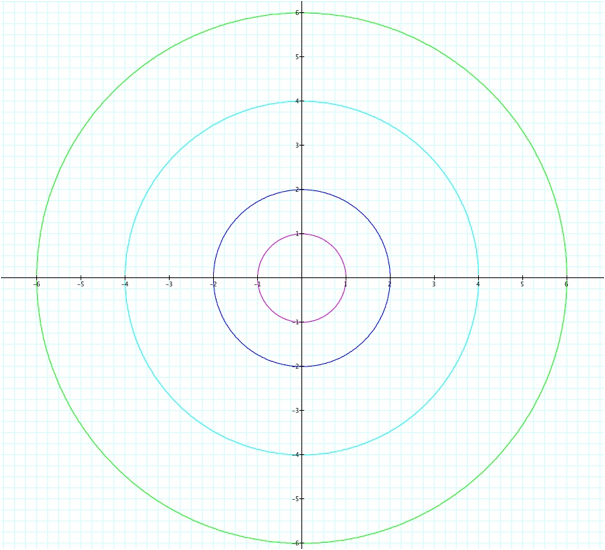
The graphs of the
parametric equations remain circles with radius=a=b.
What if a increases but b remains 1?
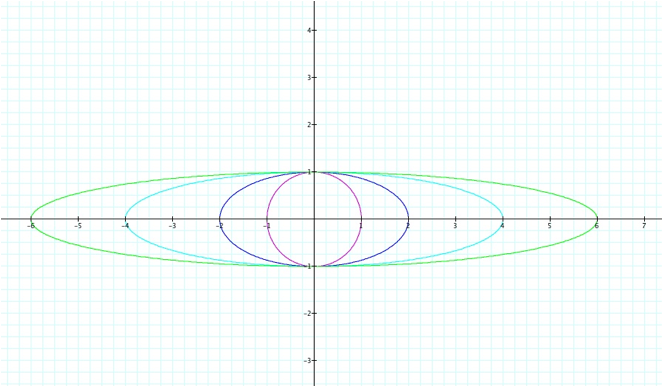
Here we see that
the graphs are ellipses, rather than circles, when a>1.
Since sine is the
vertical component of the function, each graph intercepts the y-axis at 1 and
-1.
Since cosine is the
horizontal component of the function, the function intercepts the x-axis at a and –a.
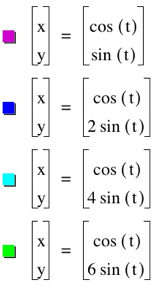
What if b increases
but a remains 1?
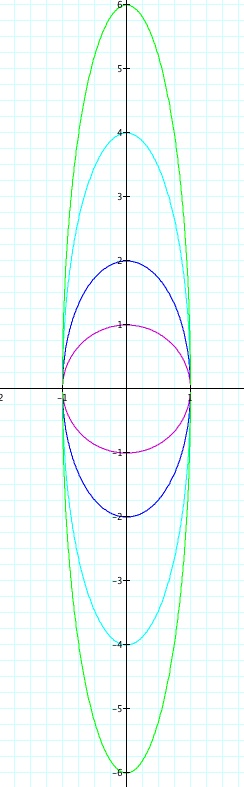
Once again, the
graphs are ellipses, rather than circle.
We see that the
function intercepts the y-axis at b and –b.
While all of the
functions intercept the x-axis at 1 and -1.
Conclusion
Here we see that
when x=a cos(t) the horizontal component of the graph is affected by the
value of a. Similarly, when y=b sin(t) the vertical component of the graph is
affected by the value of b.
We see that if a=b
the graph remains a circle with radius a=b.